
 5257
5257
This article assumes you are logged into the Manager Portal as a Call Center Supervisor, Site Manager, or Office Manager.
If you do not know your login name or password, please click here or contact CallHarbor Support.
Access Call Reports
1. Select the Call Center tab

2. Click the Reports button
![]()
3. There are five different types of Call Center Reports: Queue Stats, Agent Stats, Agent Availability, Dialed Number Stats, and Abandoned Calls. By default, the report opened will be Queue Stats.

Settings
![]()
Clicking the settings button opens the Call Center Settings.
General Settings

Service Level Agreement
The Service Level Agreement determines if a call was answered in an acceptable amount of time (seconds). This is used when calculating the Service Level stat. The higher the acceptable answer time, and/or the faster your agents answer before the acceptable answer time, will affect your overall service level positively, but the lower the acceptable number and/or the slower your agents answer, will affect your overall service level negatively.
After changing the service level agreement, click Save. Cancel will disregard.
Custom Statuses

Custom statuses can be created for agents to select. There is a maximum of 8 custom statuses that can be added. Each status can be no longer than 20 characters. Remember that all custom statuses indicate that the user is "offline" on reports.
To add a custom status, enter the name for the status in the textbox, then click the Plus arrow. Once all necessary statuses are created, click Save. Cancel will disregard.

Email Reports
![]()
To learn about setting up email reports, please click here.
Queue Stats
Queue Stats creates a graph for a specific stat for call queues and a table of all statistics chosen to display. The Queue Stats report is resourceful for knowing which call queues have higher hold times, total calls answered as well as total calls that entered the queue, and much more. The report can be customized to a set time and date range, and the columns that are shown on the table.

Queue Stat Equations
Call Volume (VOL) = Calls Offered (CO) + Forward (FWD) + Voicemail (VM) + Assisted Calls Handled (AST)
Calls Offered (CO) = Calls Handled (CH) + Abandoned Calls (AC)
Date and Time Range
To set the time period of the report, use the date and time selectors. Please keep in mind that the max range is 32 days
![]()
Date Selector - choose the starting date in the first date box and the ending date in the second date box

Time Selector - choose the starting time in the first time box and the ending time in the second time box

Once the date and times are entered, the report will refresh to display the information during the set date and time range.
![]()
Columns
By default, only a few columns will be selected to be displayed in the table


To change the columns displayed in the report, select the Columns button
![]()
Check the box for all needed stats to be displayed in the report.
To learn more about the stats available for selection, please click here.
We recommend checking the following columns always checked due to the equations used in the table:

Graphs
By default, the call volume graph will be selected, and all queues will be included in the graph, unless specific queues are checked in the table below the graph. If the graph is displaying all queues, the line will show in Blue. If the graph is displaying a specific queue or set of queues, the line for the graph will update to a new color
No Queues selected, so All Queues are included:

Two Specific Queues are selected, so two different colors appear in the graph:

To change the graph to another type, select Call Volume

The available graphs:
Call Volume
The line represents the total number of calls that entered call queues, including answered calls, abandoned calls, forwards, voicemail, and assisted calls handled, over the date and time range by the queue(s) selected.
Calls Handled
The line represents the total number of calls answered by agents originating through a call queue over the date and time range by the queue(s) selected. Does not include calls that are answered by the agent and then transferred.
Average Talk Time (min)
The line represents the average number of minutes spent by agents talking per answered call on calls originating through a call queue, over the date and time range by the queue(s) selected.
Average Wait Time (min)
The line represents the average number of minutes a caller spent in the queue before being dispatched to an agent over the date and time range by the queue(s) selected.
Abandoned Calls
The line represents the total number of calls that abandoned their spot in the queue, which means they hung up before being dispatched to agents over the date and time range by the queue(s) selected.
Service Level (%)
The line represents the total percentage of calls answered originating through the queue within the set Service Level Agreement, over the date and time range by the queue(s) selected.
![]()
Print will generate a page that includes the graph and the table for printing.

Download
![]()
Download will generate a file to save to your computer that includes the table only. The graph is only included in Print.

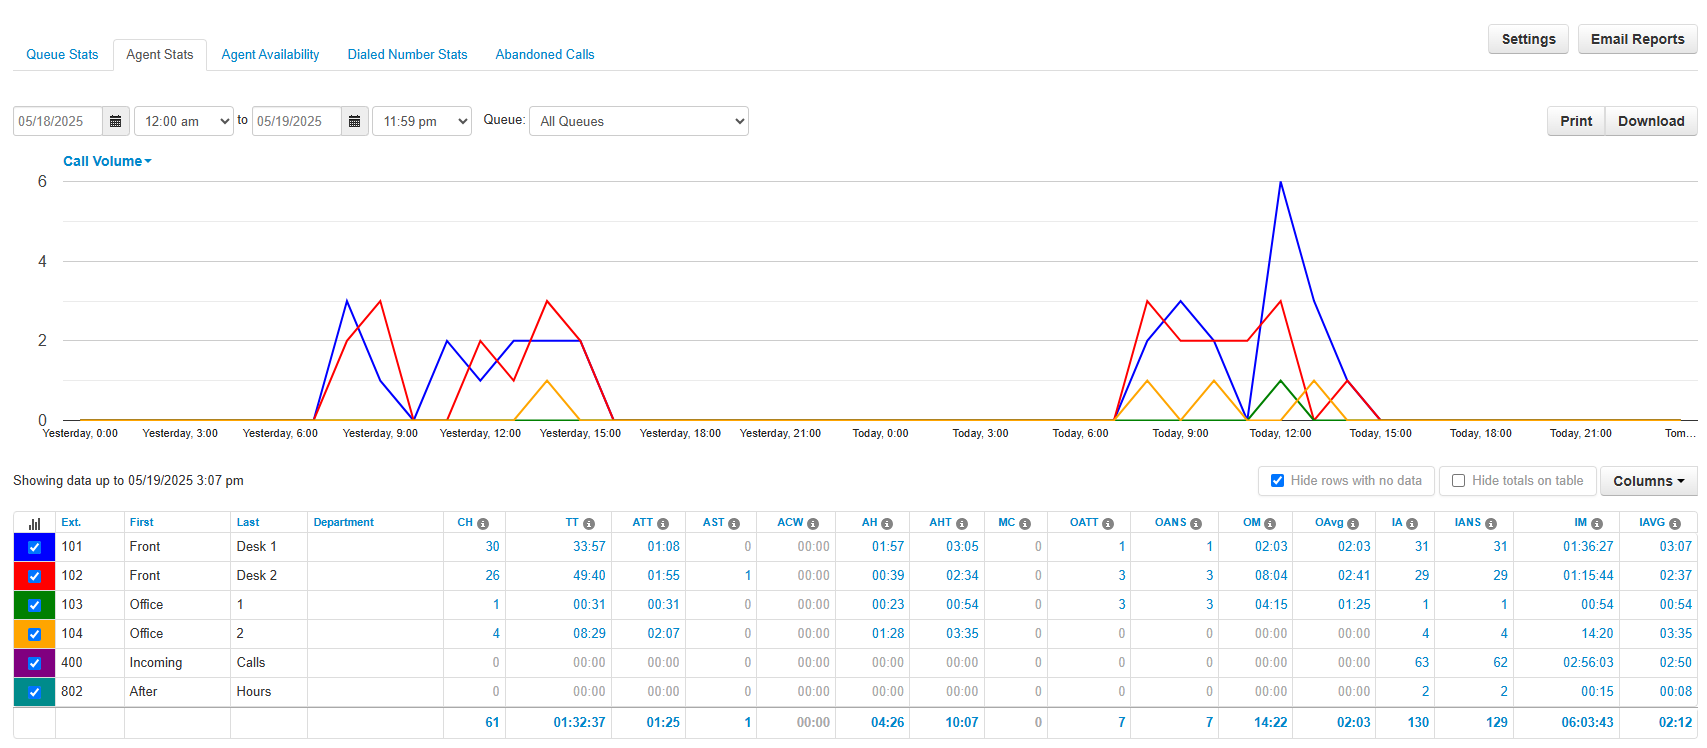
Agent Stats
Agent Stats creates a graph for a specific stat for agents and a table of all statistics chosen to display. This further breaks down the call queue stats, as you can see who answers more calls or has longer hold times, and much more. The report can be customized to a specific call queue, a set time and date range, as well as the columns that are shown on the table.
Date and Time Range
To set the time period of the report, use the date and time selectors. Please keep in mind that the max range is 32 days
![]()
Date Selector - choose the starting date in the first date box and the ending date in the second date box
Time Selector - choose the starting time in the first time box and the ending time in the second time box

Once the date and times are entered, the report will refresh to display the information during the set date and time range.
![]()
Filter to Queue
To view agents in a specific call queue, select the call queue from the Queue dropdown.

The table and graph will update to only display agents that are a part of the selected queue.
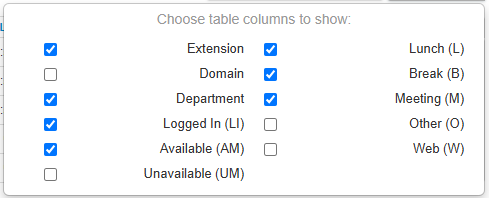
Columns
By default, only a few columns will be selected to be displayed in the table


To change the columns displayed in the report, select the Columns button
![]()
Check the box for all needed stats to be displayed in the report.
To learn more about the stats available for selection, please click here.
Graphs
By default, the call volume graph will be selected, and all agents will be included in the graph, unless specific agents are unchecked in the table below the graph.

To change the graph to another type, select Call Volume

The available graphs:
Call Volume
The line represents the total number of calls that entered call queues, including answered calls, abandoned calls, forwards, voicemail, and assisted calls handled, over the date and time range by the queue(s) selected.
Average Talk Time (min)
The line represents the average number of minutes spent by agents talking per answered call on calls originating through a call queue, over the date and time range by the queue(s) selected.
![]()
Print will generate a page that includes the graph and the table for printing.

Download
![]()
Download will generate a file to save to your computer that includes the table only. The graph is only included in Print.

Agent Availability
Agent Availability Stats creates a line graph that shows the agent's availability and a table of the agents' availability throughout a set period of time. The report can be customized to a specific department, a set time and date range, and the columns that are shown on the table.

Date and Time Range
To set the time period of the report, use the date and time selectors. Please keep in mind that the max range is 32 days
![]()
Date Selector - choose the starting date in the first date box and the ending date in the second date box
Time Selector - choose the starting time in the first time box and the ending time in the second time box
Once the date and times are entered, the report will refresh to display the information during the set date and time range.
![]()
Filter to Department
To view agents in a specific department, select the department from the Department dropdown.

The table and graph will update to only display agents that are a part of the selected department.
Columns
By default, only a few columns will be selected to be displayed in the table
To change the columns displayed in the report, select the Columns button
![]()
Check the box for all needed stats to be displayed in the report.
To learn more about the stats available for selection, please click here.
Graph

Each status that an agent selects will be displayed in the graph. The agent availability report required agents to update their statuses for accurate reporting. If statuses are not being updated, agents may be marked as available all the time.
![]()
Print will generate a page that includes the graph and the table for printing.

Download
![]()
Download will generate a file to save to your computer that includes the table only. The graph is only included in Print.
Select to download statistic or agent log

Statistic

Statistic downloads the table displayed in the report
Agent Log

Agent Log will include a record for each time an agent updates their status
Dialed Number Stats
Dialed Number Stats creates a graph for a specific stat for dialed numbers and a table of all statistics chosen to display. The dialed number stats report is useful for determining your busiest numbers on your phone system, as well as average hold times and the number of calls answered. The report can be customized to a specific call queue, a set time and date range, and the columns that are shown on the table.

Dialed Number Equations
Call Volume (VOL) = Calls Offered (CO) + Forward (FWD) + Voicemail (VM) + Assisted Calls Handled (AST)
Calls Offered (CO) = Calls Handled (CH) + Abandoned Calls (AC)
Date and Time Range
To set the time period of the report, use the date and time selectors. Please keep in mind that the max range is 32 days
![]()
Date Selector - choose the starting date in the first date box and the ending date in the second date box
Time Selector - choose the starting time in the first time box and the ending time in the second time box
Once the date and times are entered, the report will refresh to display the information during the set date and time range.
![]()
Columns
By default, only a few columns will be selected to be displayed in the table


To change the columns displayed in the report, select the Columns button
![]()
Check the box for all needed stats to be displayed in the report.
To learn more about the stats available for selection, please click here.
We recommend checking the following columns always checked due to the equations used in the table:
Graphs
By default, the call volume graph will be selected, and all numbers will be included in the graph, in their own color. By default, all numbers are checked; to view the graph of a specific number, uncheck the unneeded numbers.

To change the graph to another type, select Call Volume
The available graphs:
Call Volume
The line represents the total number of calls that entered call queues, including answered calls, abandoned calls, forwards, voicemail, and assisted calls handled, over the date and time range by the queue(s) selected.
Calls Handled
The line represents the total number of calls answered by agents originating through a call queue over the date and time range by the queue(s) selected. Does not include calls that are answered by the agent and then transferred.
Average Talk Time (min)
The line represents the average number of minutes spent by agents talking per answered call on calls originating through a call queue, over the date and time range by the queue(s) selected.
Average Wait Time (min)
The line represents the average number of minutes a caller spent in the queue before being dispatched to an agent over the date and time range by the queue(s) selected.
Abandoned Calls
The line represents the total number of calls that abandoned their spot in the queue, which means they hung up before being dispatched to agents over the date and time range by the queue(s) selected.
Service Level (%)
The line represents the total percentage of calls answered originating through the queue within the set Service Level Agreement, over the date and time range by the queue(s) selected.
![]()
Print will generate a page that includes the graph and the table for printing.

Download
![]()
Download will generate a file to save to your computer that includes the table only. The graph is only included in Print.

Abandoned Calls
Abandoned creates a graph and table of all abandoned calls in the call queues. Abandoned calls are calls where the caller hangs up while still waiting in the queue to be dispatched to agents. This is very resourceful as it will include the date and time, the caller's name and number, which queue they ended up in, what number they dialed, and how long they were waiting before hanging up.
Abandoned does not have customizable settings like the other types, but the reports can still be printed or downloaded.
![]()
Print will generate a page that includes the graph and the table for printing.

Download
![]()
Download will generate a file to save to your computer that includes the table only. The graph is only included in Print.


